SherpaDesk's Developer's Corner
By Eugene Tolmachov (SherpaDesk Head Developer)
HubSpot is a well known “all-in-one digital marketing software” that provides tools that help companies with their blogging, SEO, social media, email, landing pages, marketing automation, and web analytics. You can choose to either integrate the software into your current website, or build your company’s entire website on HubSpot, as it also acts as a content management system (CMS).
SherpaDesk has been using this tool for last 2 years very effectively.
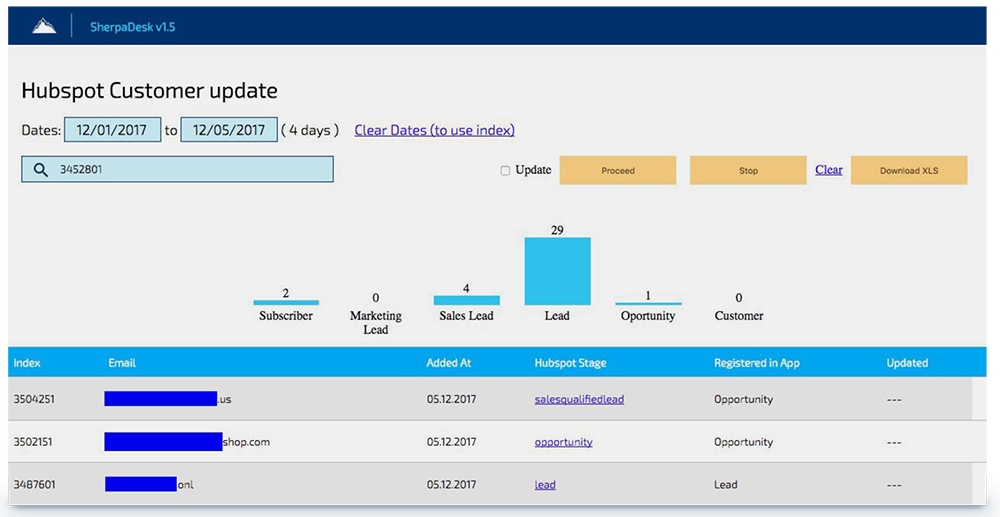
Last month I got a task from our CEO to produce a report of all our customer's HubSpot's current life cycle stages (i.e. a report of how many leads, subscribers, customers, and so on that SherpaDesk has during any time frame). This is a very useful report for marketing and sales as it provides a snapshot of your current customer's journey and purchase funnel (how many contacts are on what stage of the funnel / journey).
As important as this report is for marketing and sales, it’s currently only available from HubSpot via their reporting add-on (for an additional $200+ per month fee). But even the report currently available through the HubSpot add-on didn’t quite fully cover our needs because some life cycle changes that our customers go through do not occur in HubSpot but rather inside our proprietary SherpaDesk app.
My task was to capture all our customer lifecycle stages on our SherpaDesk (Customer Support Service) API and update their records in HubSpot accordingly so that both systems were in sync. On top of that, we needed to be able to pull a report for a specific date range (i.e. last week, last month, etc.).
The Challenge
Hubspot does offer API access.
But many developers complain that its missing some important features like search by dates or custom fields. This was really a challenge of the tallest order: How do you create this report using the existing HubSpot API?
But if there's a will there’s a way.
Even if you only have a basic knowledge of Javascript, you can use HubSpot’s API to get user's info and then display this info as a HTML page. The trick was to add the other requirements of the brief: Date range and custom fields.

Let’s build this report in 3 easy steps.
Generate a HubSpot Custom Report
1) Access HubSpot API
To access HubSpot’s API you first need to obtain an API key.
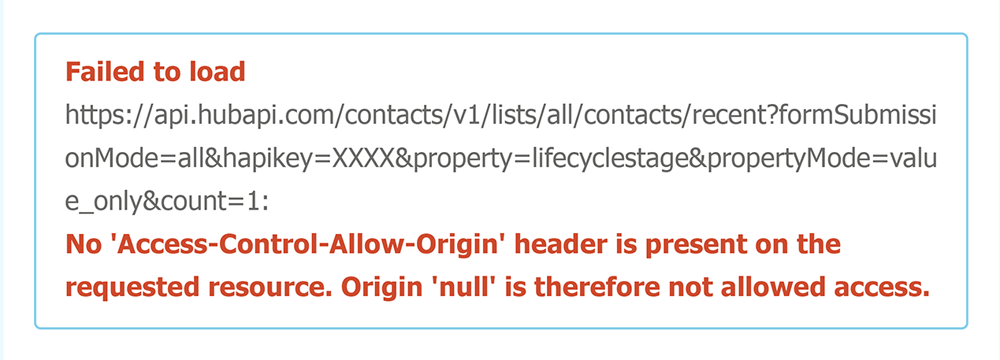
The first issue you will encounter is trying to do an AJAX request to the API (this is a CORS issue).

To pass this you can use a free CORS wrapper like https://crossorigin.me/ Here is the sample code:
var cors_api_url = 'https://' + cors_api_host + '/';
var slice = [].slice;
var origin = window.location.protocol + '//' + window.location.host;
var open = XMLHttpRequest.prototype.open;
XMLHttpRequest.prototype.open = function() {
var args = slice.call(arguments);
var targetOrigin = /^https?:\/\/([^\/]+)/i.exec(args[1]);
if (targetOrigin && targetOrigin[0].toLowerCase() !== origin &&
targetOrigin[1] !== cors_api_host) {
args[1] = cors_api_url + args[1]; }
return open.apply(this, args);
};
})();
Now you can send any request to HubSpot’s API from Javascript.
Here is my function sample code:
"https://api.hubapi.com/contacts/v1/lists/all/contacts/all?hapikey=XXXX&pr operty=lifecyclestage&propertyMode=value_only&count=1&vidOffset=";
function getUserData(index) {
var XHR = new XMLHttpRequest();
// Define what happens on successful data submission
XHR.addEventListener("load", function(event) {
showResult(event.target.responseText, index);
});
// Define what happens in case of error
XHR.addEventListener("error", function(event) {
alert('Oups! Something goes wrong.');
stopnow();
});
// Set up our request
XHR.open("GET", UserHubspotURL+index, false);
// The data sent is what the user provided in the form XHR.send();
XHR.send();
}
Our UserHubSpotURL gets a list of all users from a specific index. I decided to get these users one by one and show them as a table.
2) Update User’s Lifestage
According to API docs, “Lifecycle Stage denotes the stage at which the contact is in. Stages include 'subscriber', 'lead', 'marketing qualified lead', 'sales qualified lead', 'opportunity' and 'customer'. “
You need to pay attention to the fact that Lifecycle stages are not designed to move backwards. If you need to set this property to a previous stage, you will first need to set the value to "" (an empty string) and then set the new stage.
So you need to check the current and updated value:
"https://api.hubapi.com/contacts/v1/contact/email/testingapis@hubspot.co m/profile?hapikey=demo";
function updateUserData(index, email, name, value) {
var XHR = new XMLHttpRequest();
// Define what happens on successful data submission
XHR.addEventListener("load", function(event) {
document.getElementById("u"+index).innerHTML =
event.target.responseText;
});
// Define what happens in case of error
XHR.addEventListener("error", function(event) {
alert('Oups! Something goes wrong.');
stopnow();
});
// Set up our request
XHR.open('POST', UpdateUserDataURL);
var formData = '{
"properties": [
{
"property": "lifecyclestage",
"value": '+value+'
}
]
}';
// execute results
XHR.send(formData);
}
3) Collecting user info in specific date ranges
HubSpot’s API is limited to collect all contacts or to search them by email, name, or company name only.
The only method we can use to get the dates when these contacts were created is GET /contacts/v1/lists/:list_id/contacts/recent
I got the idea to grab the most recent contacts and then use vidO set and timeO set to page backwards. When I reach my desired date period, I will then start to show records on the page.
As a result, the user will only see their date period of interest.
Here’s HubSpot’s notes on how to use vidO set & timeO set.
We start by using this query
(//api.hubapi.com/contacts/v1/lists/contacts/recent?hapikey=XXXX)
Which returns a list of contacts, and then the offsets:
"contacts" : [],
"vid-offset" : 1111,
" time-offset" : 1311111111111
}
And then we construct our next query as:
(//api.hubapi.com/contacts/v1/lists/contacts/recent?hapikey=XXXX&vidO se t=1111&timeO set=1311111111111)
Bonus: Export the HTML table to an Excel file.
To generate statistics on retrieved data you may need to export the results to Excel. This code snippet will help you:
var htmls = "";
var uri = 'data:application/vnd.ms-excel;base64,';
var template = '<html xmlns:o="urn:schemas-microsoft-com:office:office"
xmlns:x="urn:schemas-microsoft-com:office:excel"
xmlns="http://www.w3.org/TR/REC-html40"><head><!--[if gte mso 9]><xml><x:ExcelWorkbook><x:ExcelWorksheets><x:ExcelWorksheet>< x:Name>{worksheet}</x:Name><x:WorksheetOptions><x:DisplayGridline s/></x:WorksheetOptions></x:ExcelWorksheet></x:ExcelWorksheets></x :ExcelWorkbook></xml><![endif]--></head><body><table>{table}</tab le></body></html>';
var base64 = function(s) {
return window.btoa(unescape(encodeURIComponent(s)))
};
var format = function(s, c) {
return s.replace(/{(\w+)}/g, function(m, p) {
return c[p];
})
};
// ID of html table
htmls = document.getElementById("table").innerHTML;
var ctx = {
worksheet : 'Worksheet',
table : htmls
}
var link = document.createElement("a");
link.download = "export.xls";
link.href = uri + base64(format(template, ctx));
link.click();
}
Report Generation
You can use this data to generate any type of reports and statistics with Excel or other Javascript tools (i.e. GoJS.net, ChartJS)


comments